Chemistry 20 - Analyze P-V-T graphs
LESSON = canonical instructional unit covering official Chemistry 20 outcomes. SESSION = bootcamp delivery event. A bootcamp session may overlay several Unit A lessons.
Canonical lesson CHEMISTRY20-U2-L09 · outcome 20-B1.3s · depth CURRICULUM_BASELINE
Unit B: Gases - outcome 20-B1.3s
- Course: CHEMISTRY20 (SCN2796)
- Lesson ID:
CHEMISTRY20-U2-L09 - Official outcome:
20-B1.3s(SKILL) - Object type: canonical lesson (not a bootcamp session)
- Source: Alberta Chemistry 20 Program of Studies (2007, updated 2014)
Official outcome text
analyze data and apply mathematical and conceptual models to develop and assess possible solutions • graph and analyze experimental data that relate pressure and temperature to gas volume (AI-NS2) • identify the limitations of measurement (AI-NS4) • identify a gas based on an analysis of experimental data (AI-NS2) [ICT C7-4.2]
Learning intention
Meet 20-B1.3s with instruction, practice, and a check. The 10-session bootcamp does not replace this lesson.
Success criteria
- Restate the outcome in classroom language without swapping in a different unit’s template.
- Complete the worked-style task for this outcome.
- Name the lab setting (classroom-supervised / teacher demo / dataset or simulation / forbidden).
Teaching
Analyze graphs of P vs V, V vs T; identify measurement limits; optionally identify a gas from molar-mass-from-volume data if provided.
Worked example
From a given table, plot V vs T (K) and comment on linearity; state one limitation (narrow T range).
Guided practice
- Graph using kelvin; mark absolute-zero extrapolation as model-only.
- Near-miss: titration curve pasted as gas analysis. Wrong-unit.
Independent practice
- Compute an approximate slope and interpret.
- Limitation of measurement sentence.
- If molar-mass-from-volume given, show n = m/M and V relation once.
Diagram / whiteboard
Approved diagram id chem20-pv-boyle - P-V Boyle sketch (or gas law axes). Tutor may open the course whiteboard and display this id. Do not invent hazardous procedures on the board.
Checks for understanding
Use the formative evidence below as the exit check for this outcome. Correct the misconception named in this lesson before praising.
Misconception to repair
Forcing a line through (0 °C, 0) instead of 0 K.
Safety and lab register
Setting: Paper analysis. AI Tutor must not invent labs outside CHEM20_LOW_RESOURCE_LAB_REGISTER.csv.
Alberta Poison Control if a real exposure is occurring: 1-844-764-7669. The AI Tutor is not a poison centre.
Formative evidence
Graph + limitation + one calculation if data allow.
This is not a diploma. Mastery needs instruction + activity + check.
AI Tutor / human tutor
Ground on 20-B1.3s. No false praise. No invented procedures. No silent skip to a different unit. Human tutor if the student describes mixing bleach, tasting, or flames.
Provenance
Official POS wording from ALBERTA_SENIOR_HIGH_OFFICIAL_OUTCOMES.csv. Pack lesson written to replace Wave-4 contaminated canonical markdown.
Visual task (PROJECT_REFERENCE): Inspect the visual, notice labels, and answer the lesson prompt.
CHEM20 CHEMISTRY20 U2 L09 flowchart 039
Visual task (PROJECT_REFERENCE): Interpret the graph and state slope/intercept or trend.
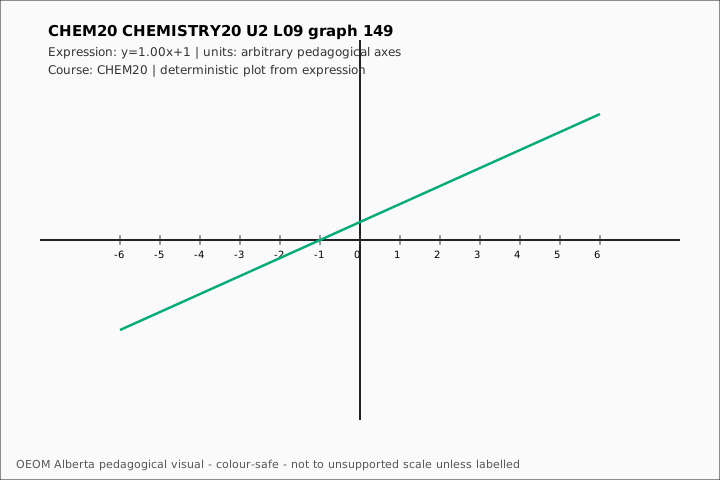
CHEM20 CHEMISTRY20 U2 L09 graph 149
Visual task (PROJECT_REFERENCE): Inspect the visual, notice labels, and answer the lesson prompt.
CHEM20 CHEMISTRY20 U2 L09 energy profile 259